How Intertrace works
Inline gateway classification, telemetry to the dashboard, and how evaluation becomes action.
Control plane
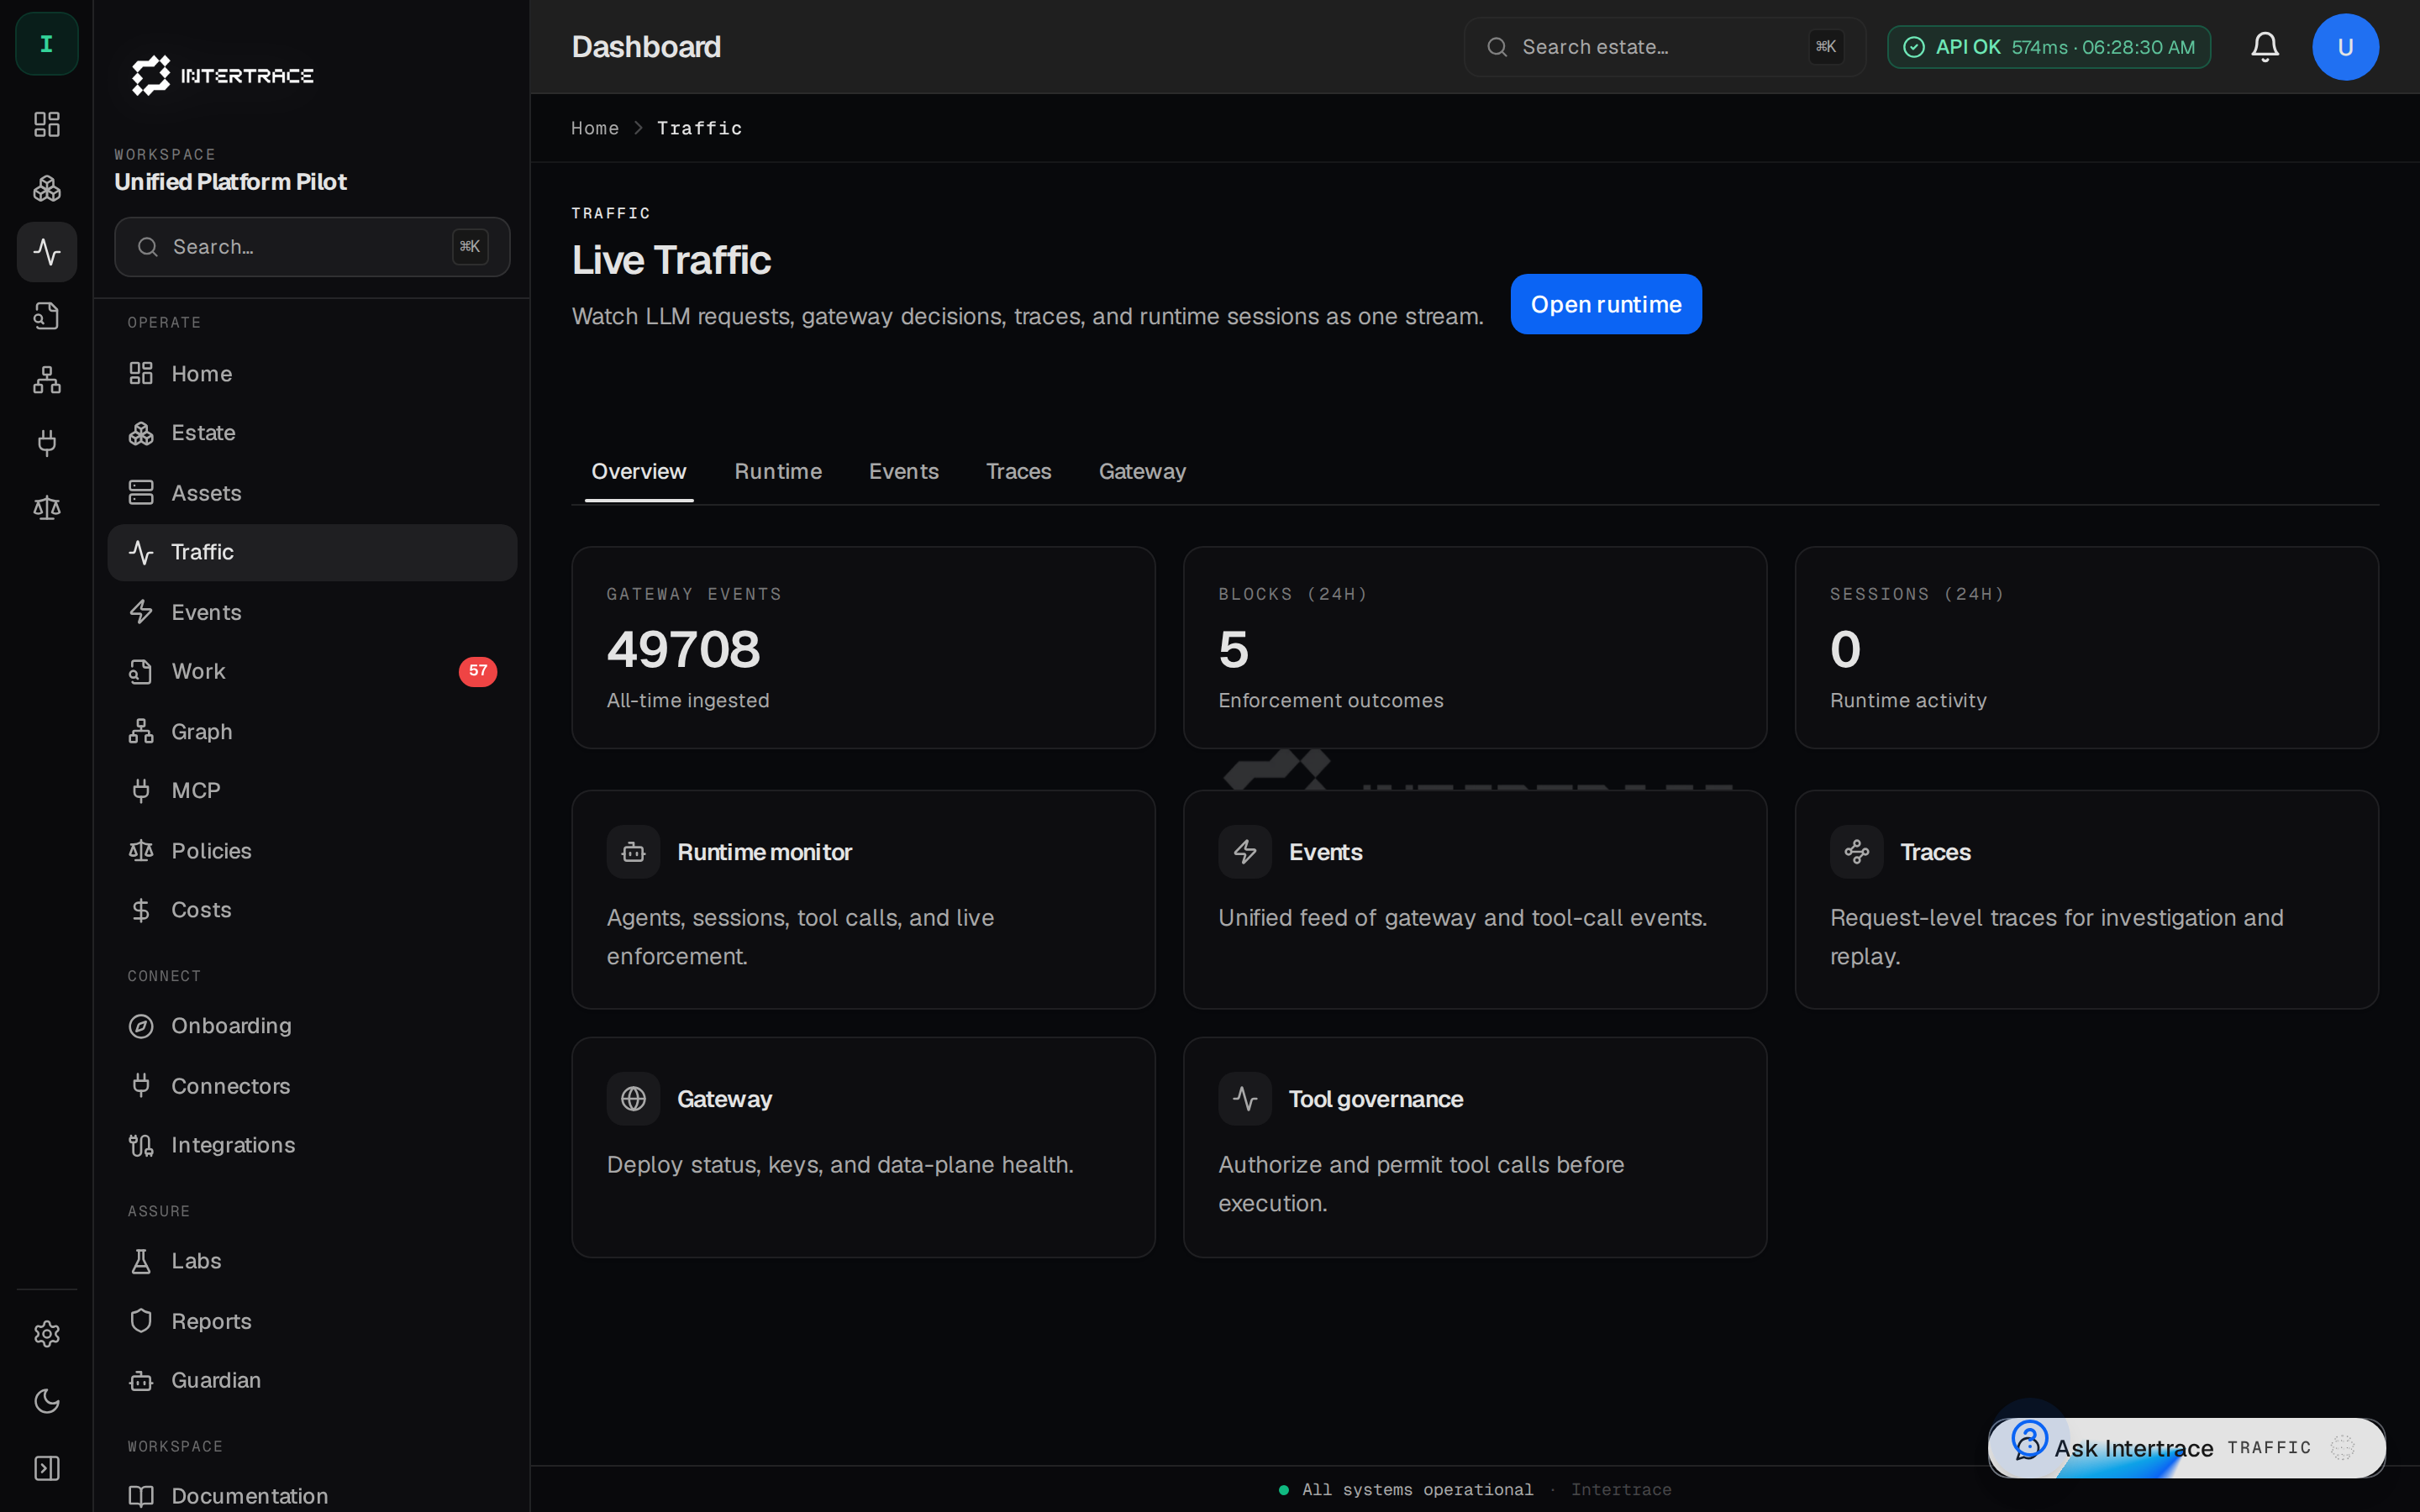
Production data plane is the Intertrace Gateway on Fly at https://intertrace.fly.dev. Clients send traffic with itr_rt_*. The kernel remains POST /v1/actions/authorize.
The Next.js app on platform.intertrace.ai is the control plane: it ingests events, stores org-scoped history, and hosts itr discover/onboard, policy gitops, approvals, imported spend, and Agent Control. Org API keys authenticate those APIs; runtime keys are rejected. Control plane.
Telemetry path
Your application or gateway emits traces to Intertrace via HTTP (Bearer API key). Each trace contains spans representing steps, tool calls, and outcomes. Optional dual-write can mirror critical fields into legacy gateway event tables for backward compatibility.
Inline vs async
Inline: SDK or thin wrapper around your HTTP client records spans synchronously around each call. Lowest latency for local debugging.
Async: Webhook or queue consumer posts batches to the ingestion API. Best for high throughput and decoupled pipelines.
Gateway vs direct
If you already route model traffic through the Intertrace Gateway, gateway events may be correlated with traces. Direct integration sends traces without the gateway; both paths are supported.